In the desire to derive a “good” model for the behavior observed in the execution log, shared notions of, e.g., fitness, precision and structure can be identified in the process mining literature. As a consequence, several metrics have been developed to measure the quality of a (mined) model according to these notions. The Control Flow Benchmark plug-in can be used to calculate some of these metrics and provides an integrated view on the results. See also [1,2] for further information on this topic.
You need to open all the process models that should be compared (and the reference log and/or reference model) before you start the benchmark plug-in.
The process models do not need to be connected to the event log (the mapping is established by the benchmark plug-in itself), but the models are expected to 1) be a Petri net and 2) specify appropriate mapping information:
- You can use existing conversion techniques if your model is specified in a different modeling formalism.
- You can ensure that your model properly captures all mapping information (i.e., invisible tasks, and the log event belonging to each visible task) by using the PNML export in ProM before re-opening the model again for using the benchmark plug-in.
Note that there are example files you can use to play with the Control Flow Benchmark contained in your ProM folder at /examples/benchmark/. The same examples are used in [2] as a running example and to explain the different evaluation dimensions.
Control Flow Benchmark SettingsBefore the actual benchmark is started, one can choose which kind of metrics should be calculated. Furthermore, the reference model and/or the reference log, and the models to be compared (benchmark items) can be selected. Note that some metrics require a reference model to be present while others don't. Similarly, there are metrics that only compare the benchmark items to the reference model, and, therefore, do not need a reference log. If the input needed for a certain metric is not provided, the metric will remain disabled (see [2] for an overview of the metrics and their requirements).
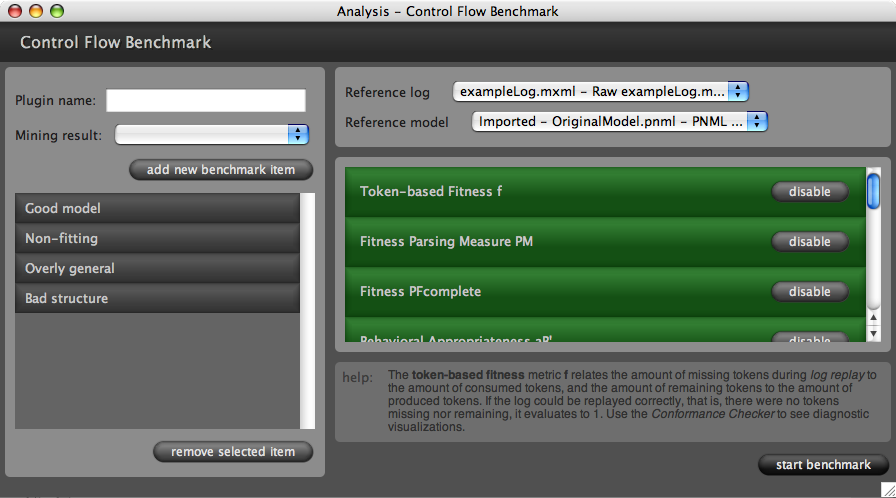
Figure 1 shows a screenshot of the settings of the Control Flow Benchmark plug-in. Note that each metric provides a short help text if you click on it. Then, the benchmark process can be started. The plug-in transparently connects each model to the reference log and calculates the chosen metrics.
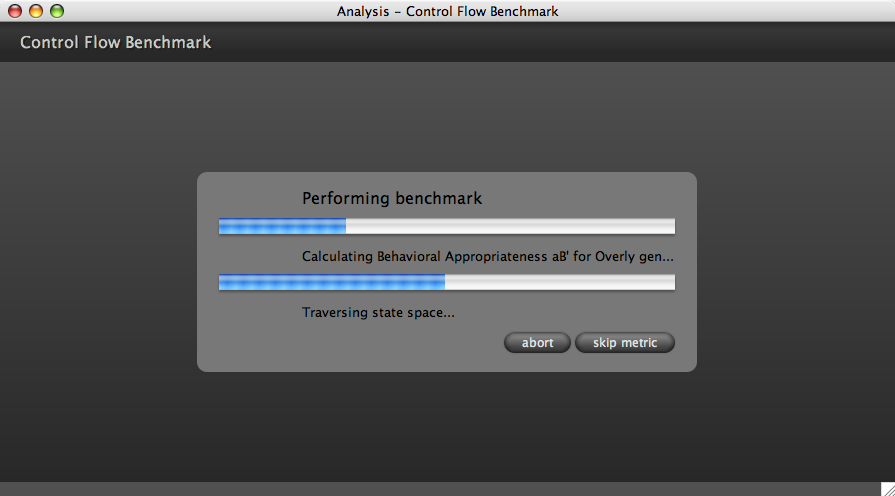
You can view the progress of this operation like shown in Figure 2. If a metric takes too long to compute, it can be either skipped (and potentially approximated) or the benchmark can be aborted, which brings you back to the initial configuration screen.
Control Flow Benchmark ResultsAll the benchmark metrics return values between 0 (interpreted as the “worst” value) and 1 (interpreted as the “best” value). Furthermore, they may be based on assumptions (such as no duplicate tasks in the process model) that might not be fulfilled. Each metric is expected to check its assumptions and to indicate the result being “invalid” if pre-conditions cannot be met.
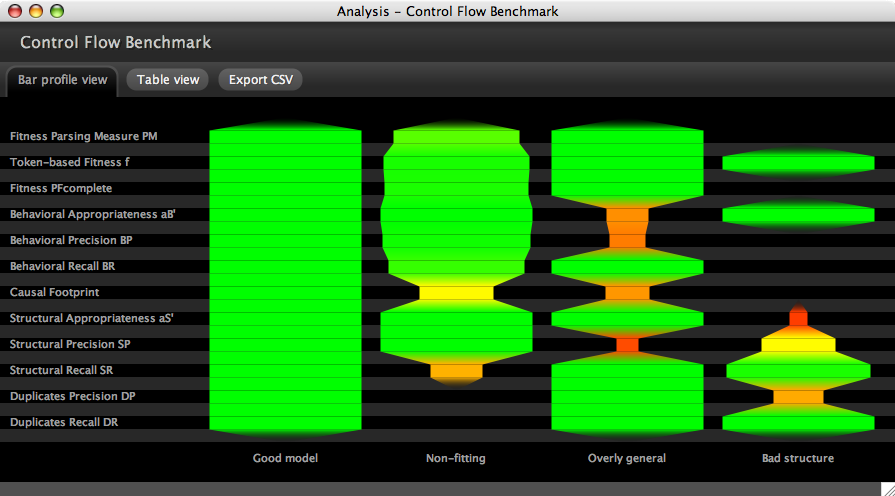
The first result view you will see once the benchmark process is finished is the Bar Profile view (see screenshot in Figure 3). It visualizes the calculated values along a so-called bar profile in a fixed order. Green values are “good” and red values are “problematic” according to the corresponding metric. Invalid values are left out (i.e., the bar profile will have a gap at this place). The profile part between two values is interpolated. This way, this view provides a graphical overview that makes it easy to spot problematic areas, which can be successively inspected in further detail.
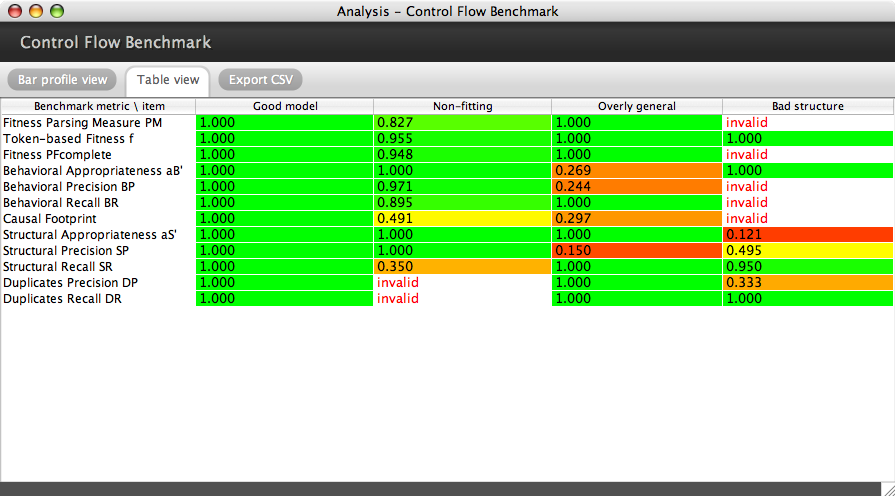
The view can be changed to Table view (see screenshot in Figure 4) for inspecting the detailed results. The exact values are shown for each benchmark item, or “invalid” is given if it could not be computed for a certain case.
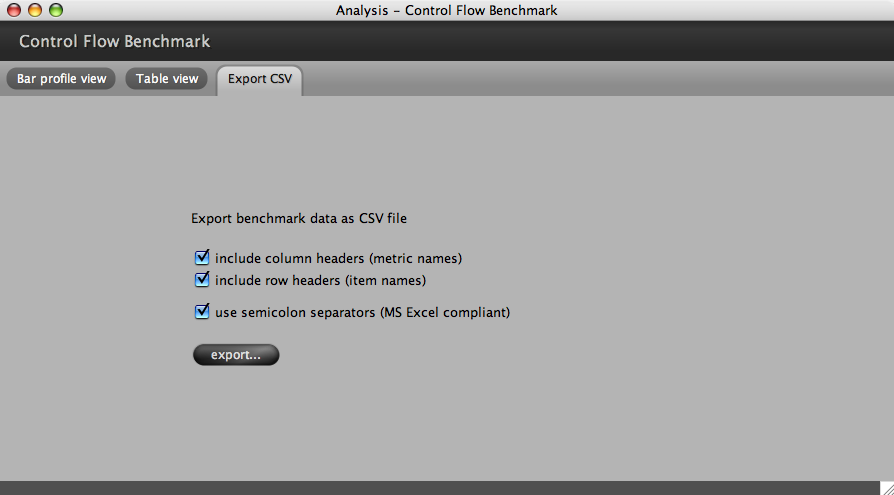
Finally, the calculated values can be exported in Comma Separated Values (CSV) format. The option to export the values with semicolon separators (rather than commas) makes it easy to directly open the file in MS Excel.
Publications-
The Need for a Process Mining Evaluation Framework in Research and Practice
A. Rozinat, A.K. Alves de Medeiros, C.W. Günther, A.J.M.M. Weijters, and W.M.P. van der Aalst
In Proceedings of the Third International Workshop on Business Process Intelligence (BPI'07) Queensland University of Technology, Brisbane, Australia, pp. 73-78, 2007A. Rozinat, A.K. Alves de Medeiros, C.W. Günther, A.J.M.M. Weijters, and W.M.P. van der Aalst
In A. ter Hofstede, B. Benatallah, and H.-Y. Paik (Eds.), BPM 2007 Workshops (Lecture Notes in Computer Science, Vol. 4928, pp. 84–89). Berlin: Springer, 2008 -
Towards an Evaluation Framework for Process Mining Algorithms
A. Rozinat, A.K. Alves de Medeiros, C.W. Günther, A.J.M.M. Weijters, and W.M.P. van der Aalst
BPM Center Report BPM-07-06, BPMcenter.org, 2007A. Rozinat, A.K. Alves de Medeiros, C.W. Günther, A.J.M.M. Weijters, and W.M.P. van der Aalst
BETA Working Paper Series, WP 224, Eindhoven University of Technology, Eindhoven, 2007