Semantic performance analysis shows performance metrics for
concepts in ontologies. The current version of this plug-in
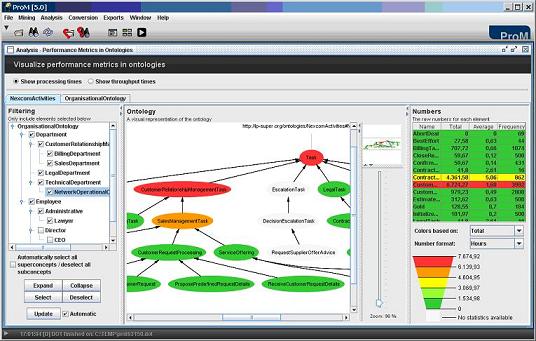
supports two metrics: processing times (cf. Figure 1) and
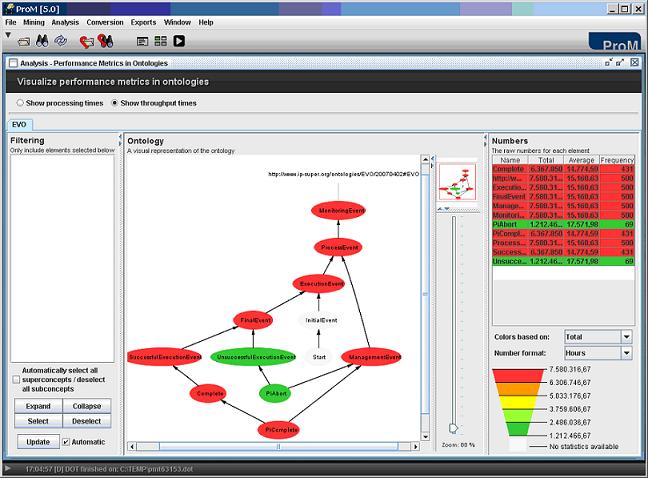
throughput times (cf. Figure 2). This plug-in has the
following functionalities:
Visualization of throughput times. This metric shows how
much time process instances of a certain concept take.
Visualization of processing times. This metric shows the
amount of time originators of certain concepts spent on work
or how much time tasks of certain concepts took to be
processed.
Visualization of performance metrics per ontologies. Each
ontology in the log to which processing/through times could
be calculated has a tab in the main panel Ontology. For
instance, Figure 1 contains two tabs: NexcomActivities and
OrganisationalOntology. Note that the tab NexcomActivities
is selected in this figure and a projected view of this
ontology is shown in the middle panel. The colors of the
concepts allow the end user to quickly spot potential
bottlenecks in the system. Dark green means fast and red
means slow (with gradations in between).
Filtering of which direct instances to take into account
during the calculation of the performance metrics. This
functionality if provided at the left panel Filtering. If a
concept is selected in this panel, all their direct
instances are taken into account. Otherwise, these instances
are not used during the calculation of the performance
metrics. For instance, in Figure 1 the concepts
OrganisationalOntology#Director and
OrganisationalOntology#CEO are deselected. Since instances
of these concepts execute tasks of the concept
NexcomAcitivites#RequestSupplierOfferAdvice, you can see
(cf. Ontology panel) that no processing time could be
calculated for these concepts.
Exportation of the actual metric numbers. The table
explained in the previous step can be exported to the CVS
format used by MS Excel.
Selection of different units for the visualization of the
performance metrics. This functionality is provided at the
bottom-right panel where the option Number format is
available.
Selection of which column of the performance table to use
when coloring the ontology and the table. This functionality
is provided at the bottom-right panel where the option
Colors based on is available.
Figure 1. Screenshot of the plug-in Performance Metrics in
Ontologies. Option Show processing times.
Figure 2. Screenshot of the plug-in Performance Metrics in Ontologies. Option Show throughput times.
How to use
Open a SA-MXML log file by clicking on File→Open Supported File….
Start the Performance Metrics in Ontologies plug-in via clicking Analysis→ LogName→ Performance Metrics in Ontologies. You should get a screen like the one in Figure 1.
If you like, you can export the table with the performance metrics to CSV format by clicking the menu option Exports→Table with values→Standard CSV(Excel).